Data Visualizer#
This script visualizes the CSV and list-mode data from our example codes.
Prerequisites#
python 3.7+
pip
venv
Linux Install Instructions#
Clone the pixie_sdk repository into your Linux environment
git clone https://github.com/xiallc/pixie_sdk.git
Create/Navigate to dev folder
mkdir ~/pixie_sdk/dev && cd ~/pixie_sdk/dev
Initialize python virtual environment
python3 -m venv venv
Activate the virtual environment
source venv/bin/activate
Ensure pip is upgraded
pip install -U pip
Install the requirements for the data visualizer
pip install -r ../examples/data_visualizer/requirements.txt
Run the data visualizer
python3 ../examples/data_visualizer/data_visualizer.py -h
Windows Install Instructions#
Clone the pixie_sdk repository to your Windows environment (Downloads folder)
Create/Navigate to dev folder
mkdir ~/pixie_sdk/dev && cd ~/pixie_sdk/dev
Initialize python virtual environment
python3 -m venv venv
Install the requirements for the data visualizer
pip install -r ../examples/data_visualizer/requirements.txt
Activate the virtual environment
.\venv\Scripts\activate
Run the data visualizer
python3 ../examples/data_visualizer/data_visualizer.py -h
To stop the virtual environment
deactivate
Usage#
usage: data_visualizer.py [-h] [-b] [-c CHAN] -f FILE [--freq FREQ] [-l] [-m]
                          [-x XLIM] [--rev REV] [-s] [-a]

Optional app description

options:
  -h, --help            show this help message and exit
  -b, --baseline        Plots MCA spectra
  -c CHAN, --chan CHAN  The channel that you'd like to plot.
  -f FILE, --file FILE  The file containing the data to read.
  --freq FREQ           The sampling frequency used to collect list-mode data.
                        Ex. 250
  -l, --lmd             Tells the program that the file is list-mode data.
  -m, --mca             Plots MCA spectra
  -x XLIM, --xlim XLIM  Comma separated range for X-axis limits. Ex. 10,400
  --rev REV             The firmware used to collect list-mode data. Ex. 30474
  -s, --stats           Processes a module's CSV statistics file.
  -a, --adc             Plots traces
Traces example#
The following example code command will produce CSV files for each module in the system. The files will be numbered according to the module. For example, pixie16api-module0-adc.csv.
example_pixie16api trace -c cfg.json
Name |
Description |
|---|---|
pixie16api-moduleX-adc.csv |
A CSV file containing the collected trace from all channels on Module X. |
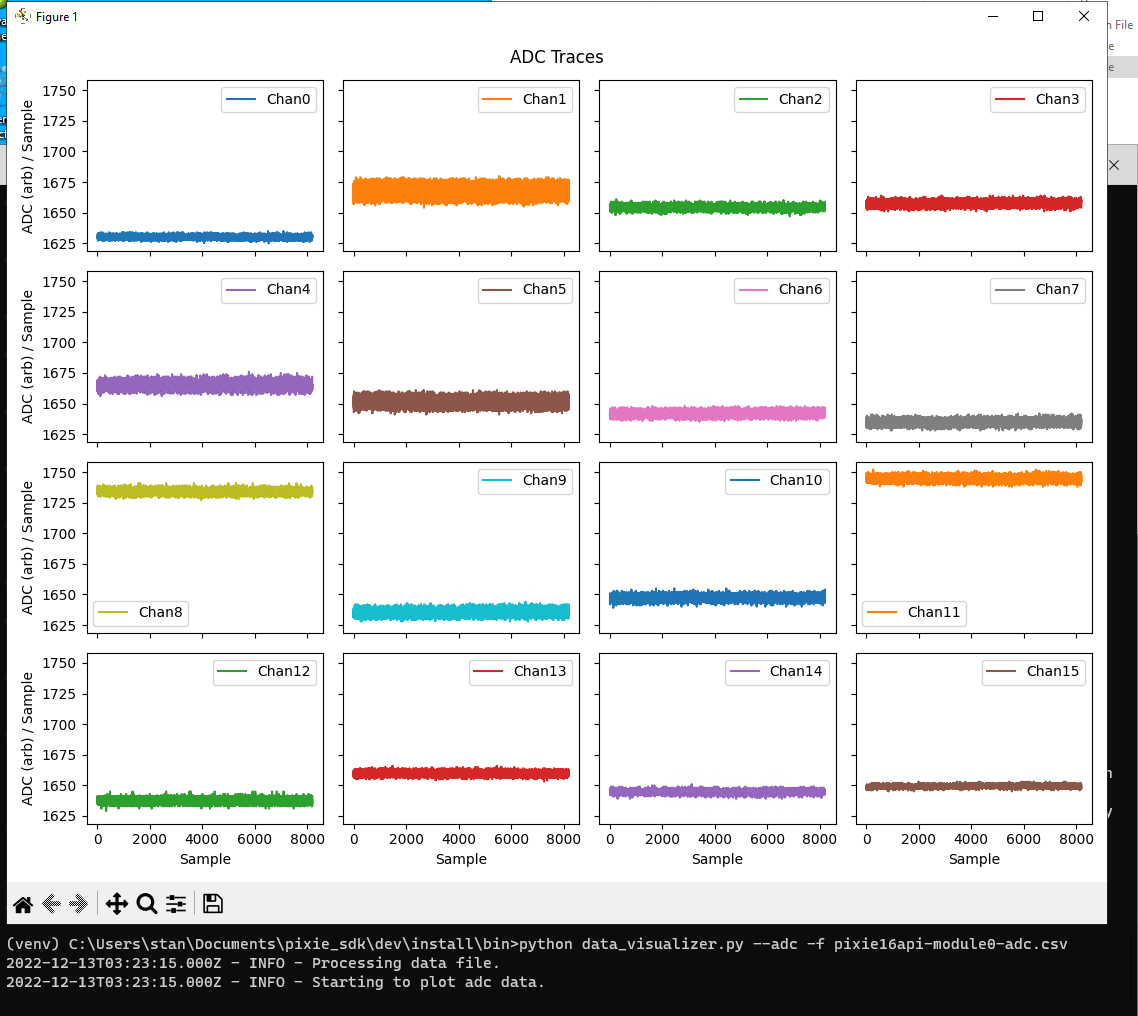
Visualizing trace data#
Warning
- The following command assumes that you’ve
installed the script into your path and
already activated your virtual environment
python data_visualizer.py --adc -f pixie16api-module0-adc.csv
MCA example#
The following example code command will produce CSV files for each module in the system. The files will be numbered according to the module AND the data run that produced it. For example, pixie16api-module0-mca-run3.csv.
example_pixie16api mca -c cfg.json --num-runs 5
Name |
Description |
|---|---|
pixie16api-moduleX-mca-runY.csv |
A CSV file containing the MCA information for Module X data Run Y. |
pixie16api-moduleX-mca-runY-stats.csv |
A CSV file containing the hardware statistics for Module X data Run Y. |
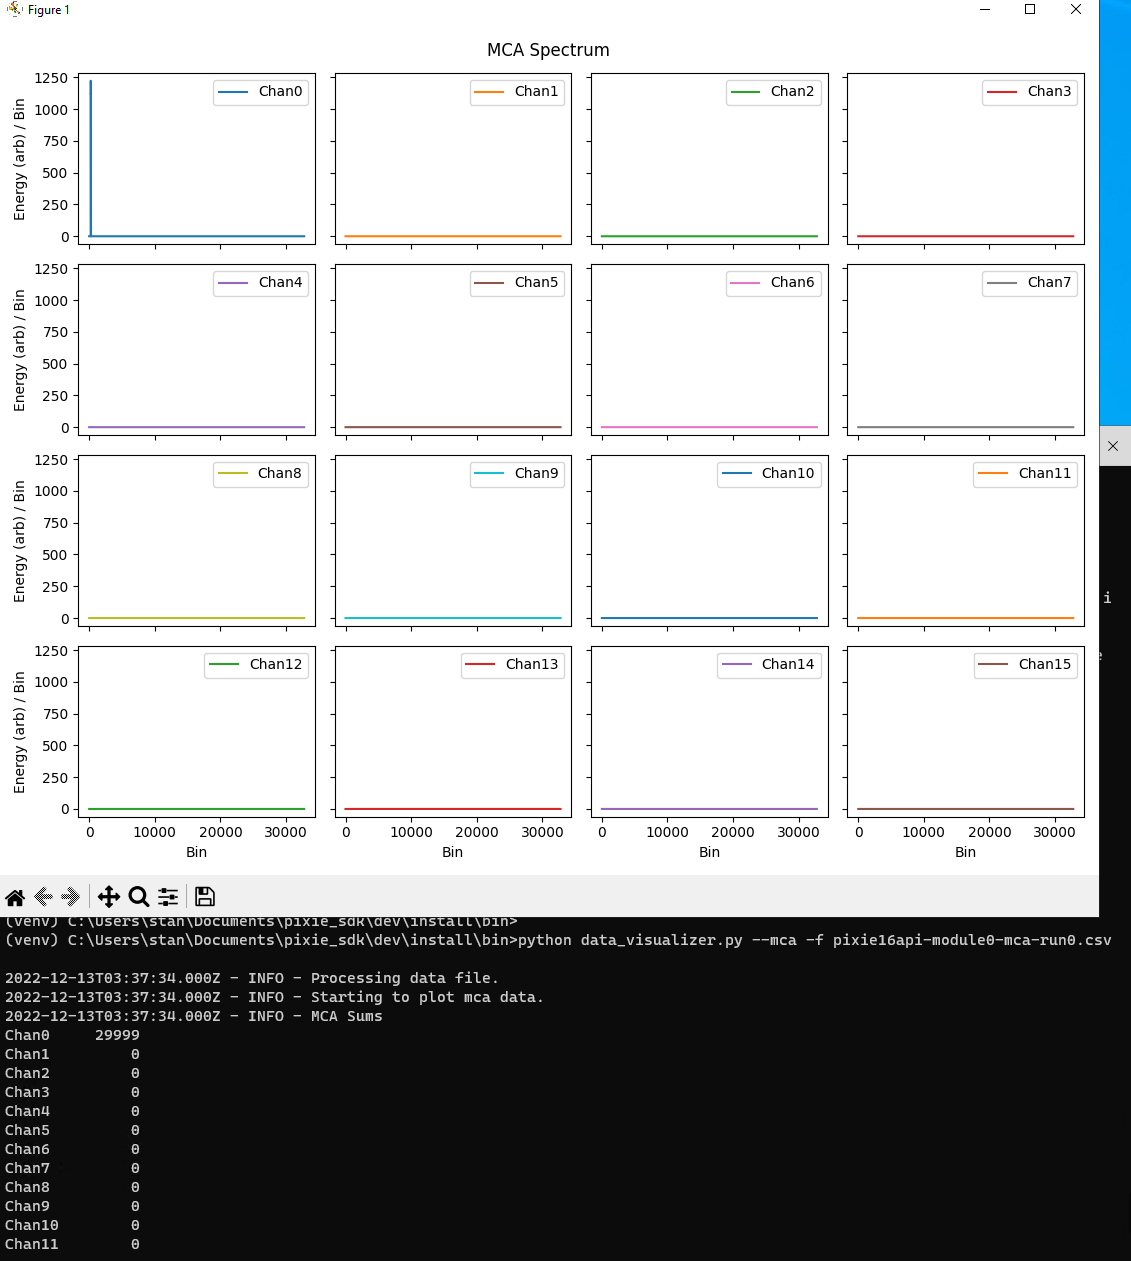
Display all channel histograms#
python data_visualizer.py --mca -f pixie16api-module0-mca-run0.csv
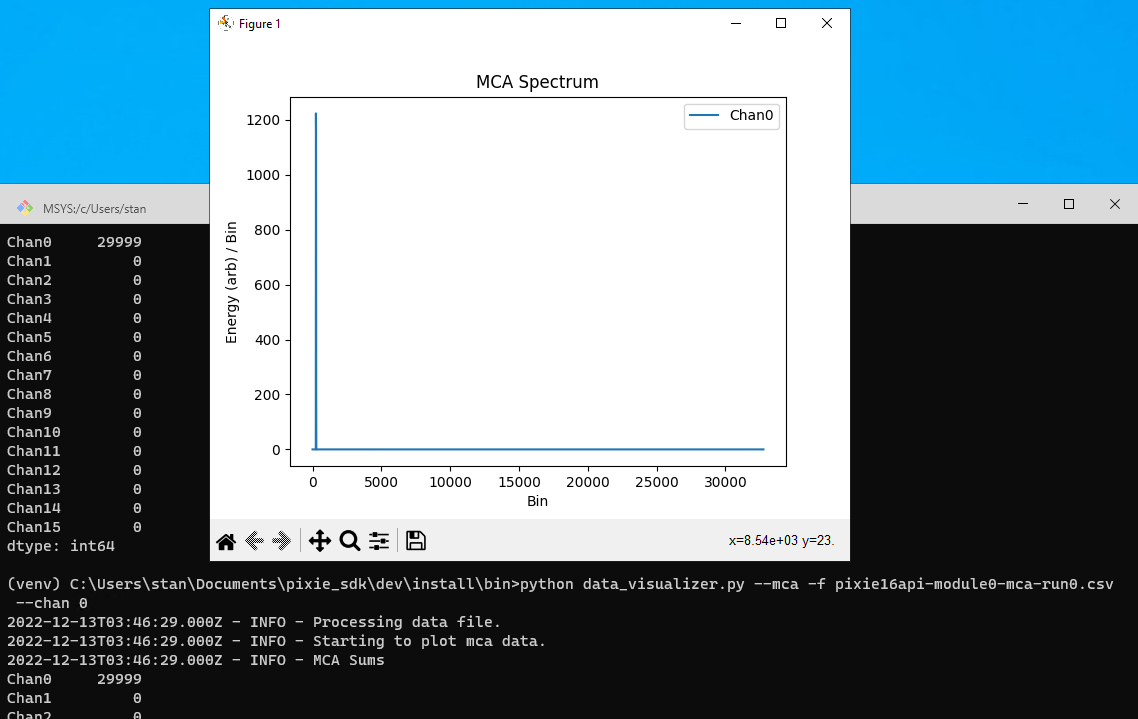
Display only Channel 0 Histogram#
python data_visualizer.py --mca -f pixie16api-module0-mca-run0.csv --chan 0
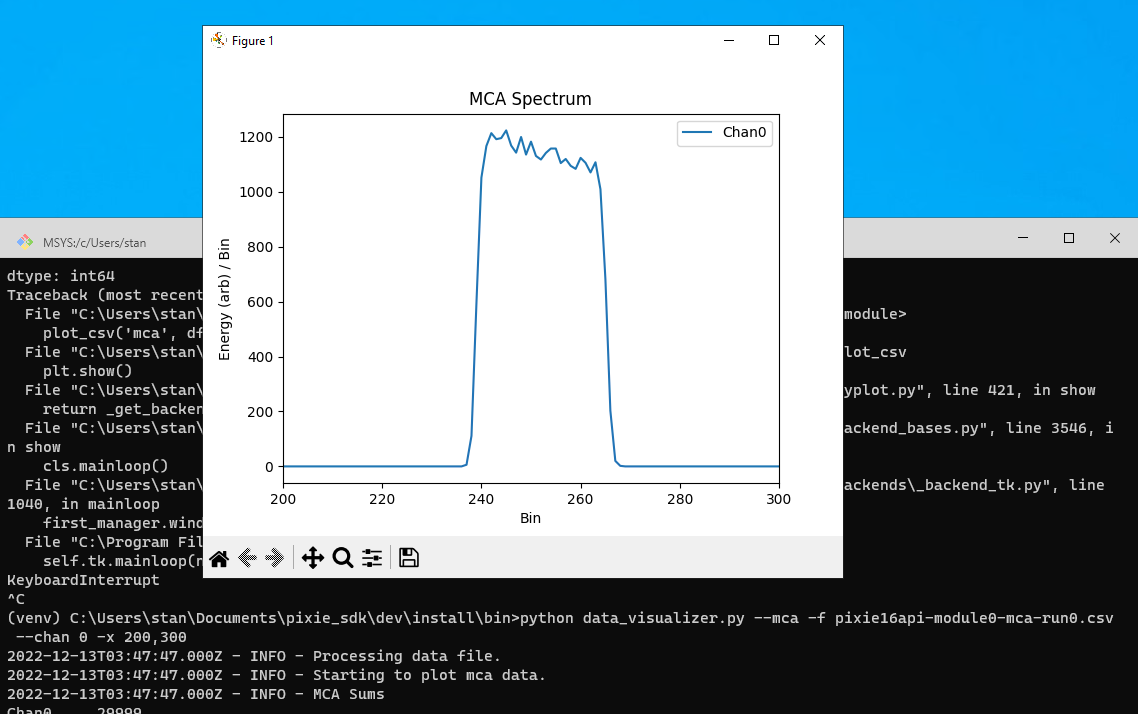
Display only Channel 0 Histogram in range [200,300]#
python data_visualizer.py --mca -f pixie16api-module0-mca-run0.csv --chan 0 -x 200,300
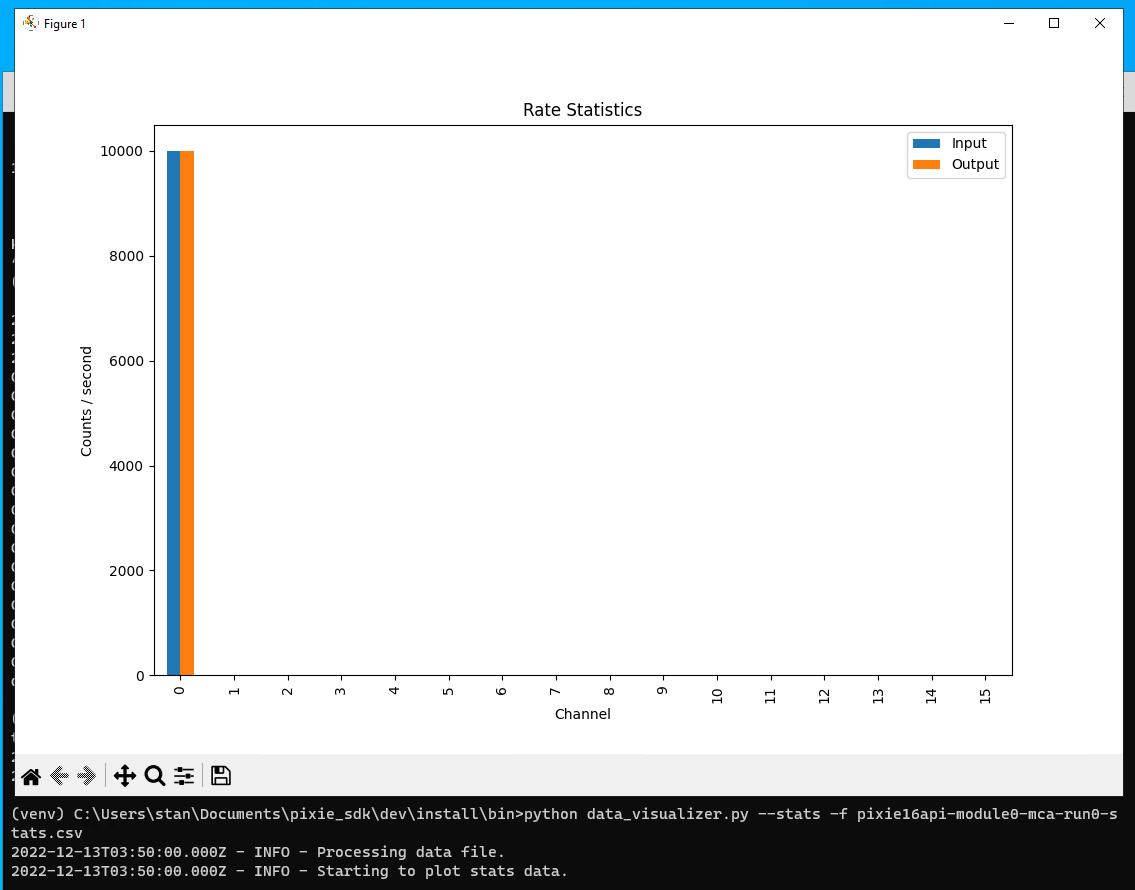
Visualize Channel Count Rate Statistics#
python data_visualizer.py --stats -f pixie16api-module0-mca-run0-stats.csv
List-mode example#
The following example code command will produce CSV files, binary data, and JSON records for each module in the system. The files will be numbered according to the module AND the data run that produced it. For example, pixie16api-module0-list-mode-run3-mca.csv.
example_pixie16api list-mode -c cfg.json --num-runs=5
Name |
Description |
|---|---|
pixie16api-moduleX-list-mode-runY- recs.bin |
Contains the raw binary data received from the Module X during data run Y. |
pixie16api-moduleX-list-mode-runY- fifo-stats.jsonl |
Contains JSON records of the list-mode worker statistics regarding Module X obtained during data run Y. Used to calculate the module’s bandwidth over time |
pixie16api-moduleX-list-mode-runY- hw-stats.csv |
Contains the hardware statistics calculated by Module X during data run Y. |
pixie16api-moduleX-list-mode-runY- mca.csv |
Contains the MCA spectrum obtained by Module X during data run Y. |
Visualizing the list-mode data is the same as the MCA data:
python data_visualizer.py --mca -f pixie16api-module0-list-mode-run0-mca.csv
python data_visualizer.py --stats -f pixie16api-module0-list-mode-run0-hw-stats.csv
We provide an example program called list_mode_file_stats that’s used to calculate statistics from the binary data files.